HostRadar DE Request a trial

Where it hurts, it says so on the label.

HostRadar reads your Hyper-V hosts and failover clusters, traces every overload to its cause and tells you what to do – with a target value instead of a chart.

Request a trial
  • One EXE, no installation
  • No agent on the hosts
  • Windows Server 2016 to 2025
  • Your data stays in-house
-X1 CLUSTER HV-CLUSTER01 Demo data · pick a module
CAUSE · HV-NODE02

Dynamic Memory has handed 353 GB to 22 VMs – the host has only 38 GB left and seven VMs are already paging.

RECOMMENDATION

Move BUILD01 to HV-NODE03: HV-NODE02 drops to 78 % RAM. Alternatively cap the maximum memory of these VMs.

The real interface

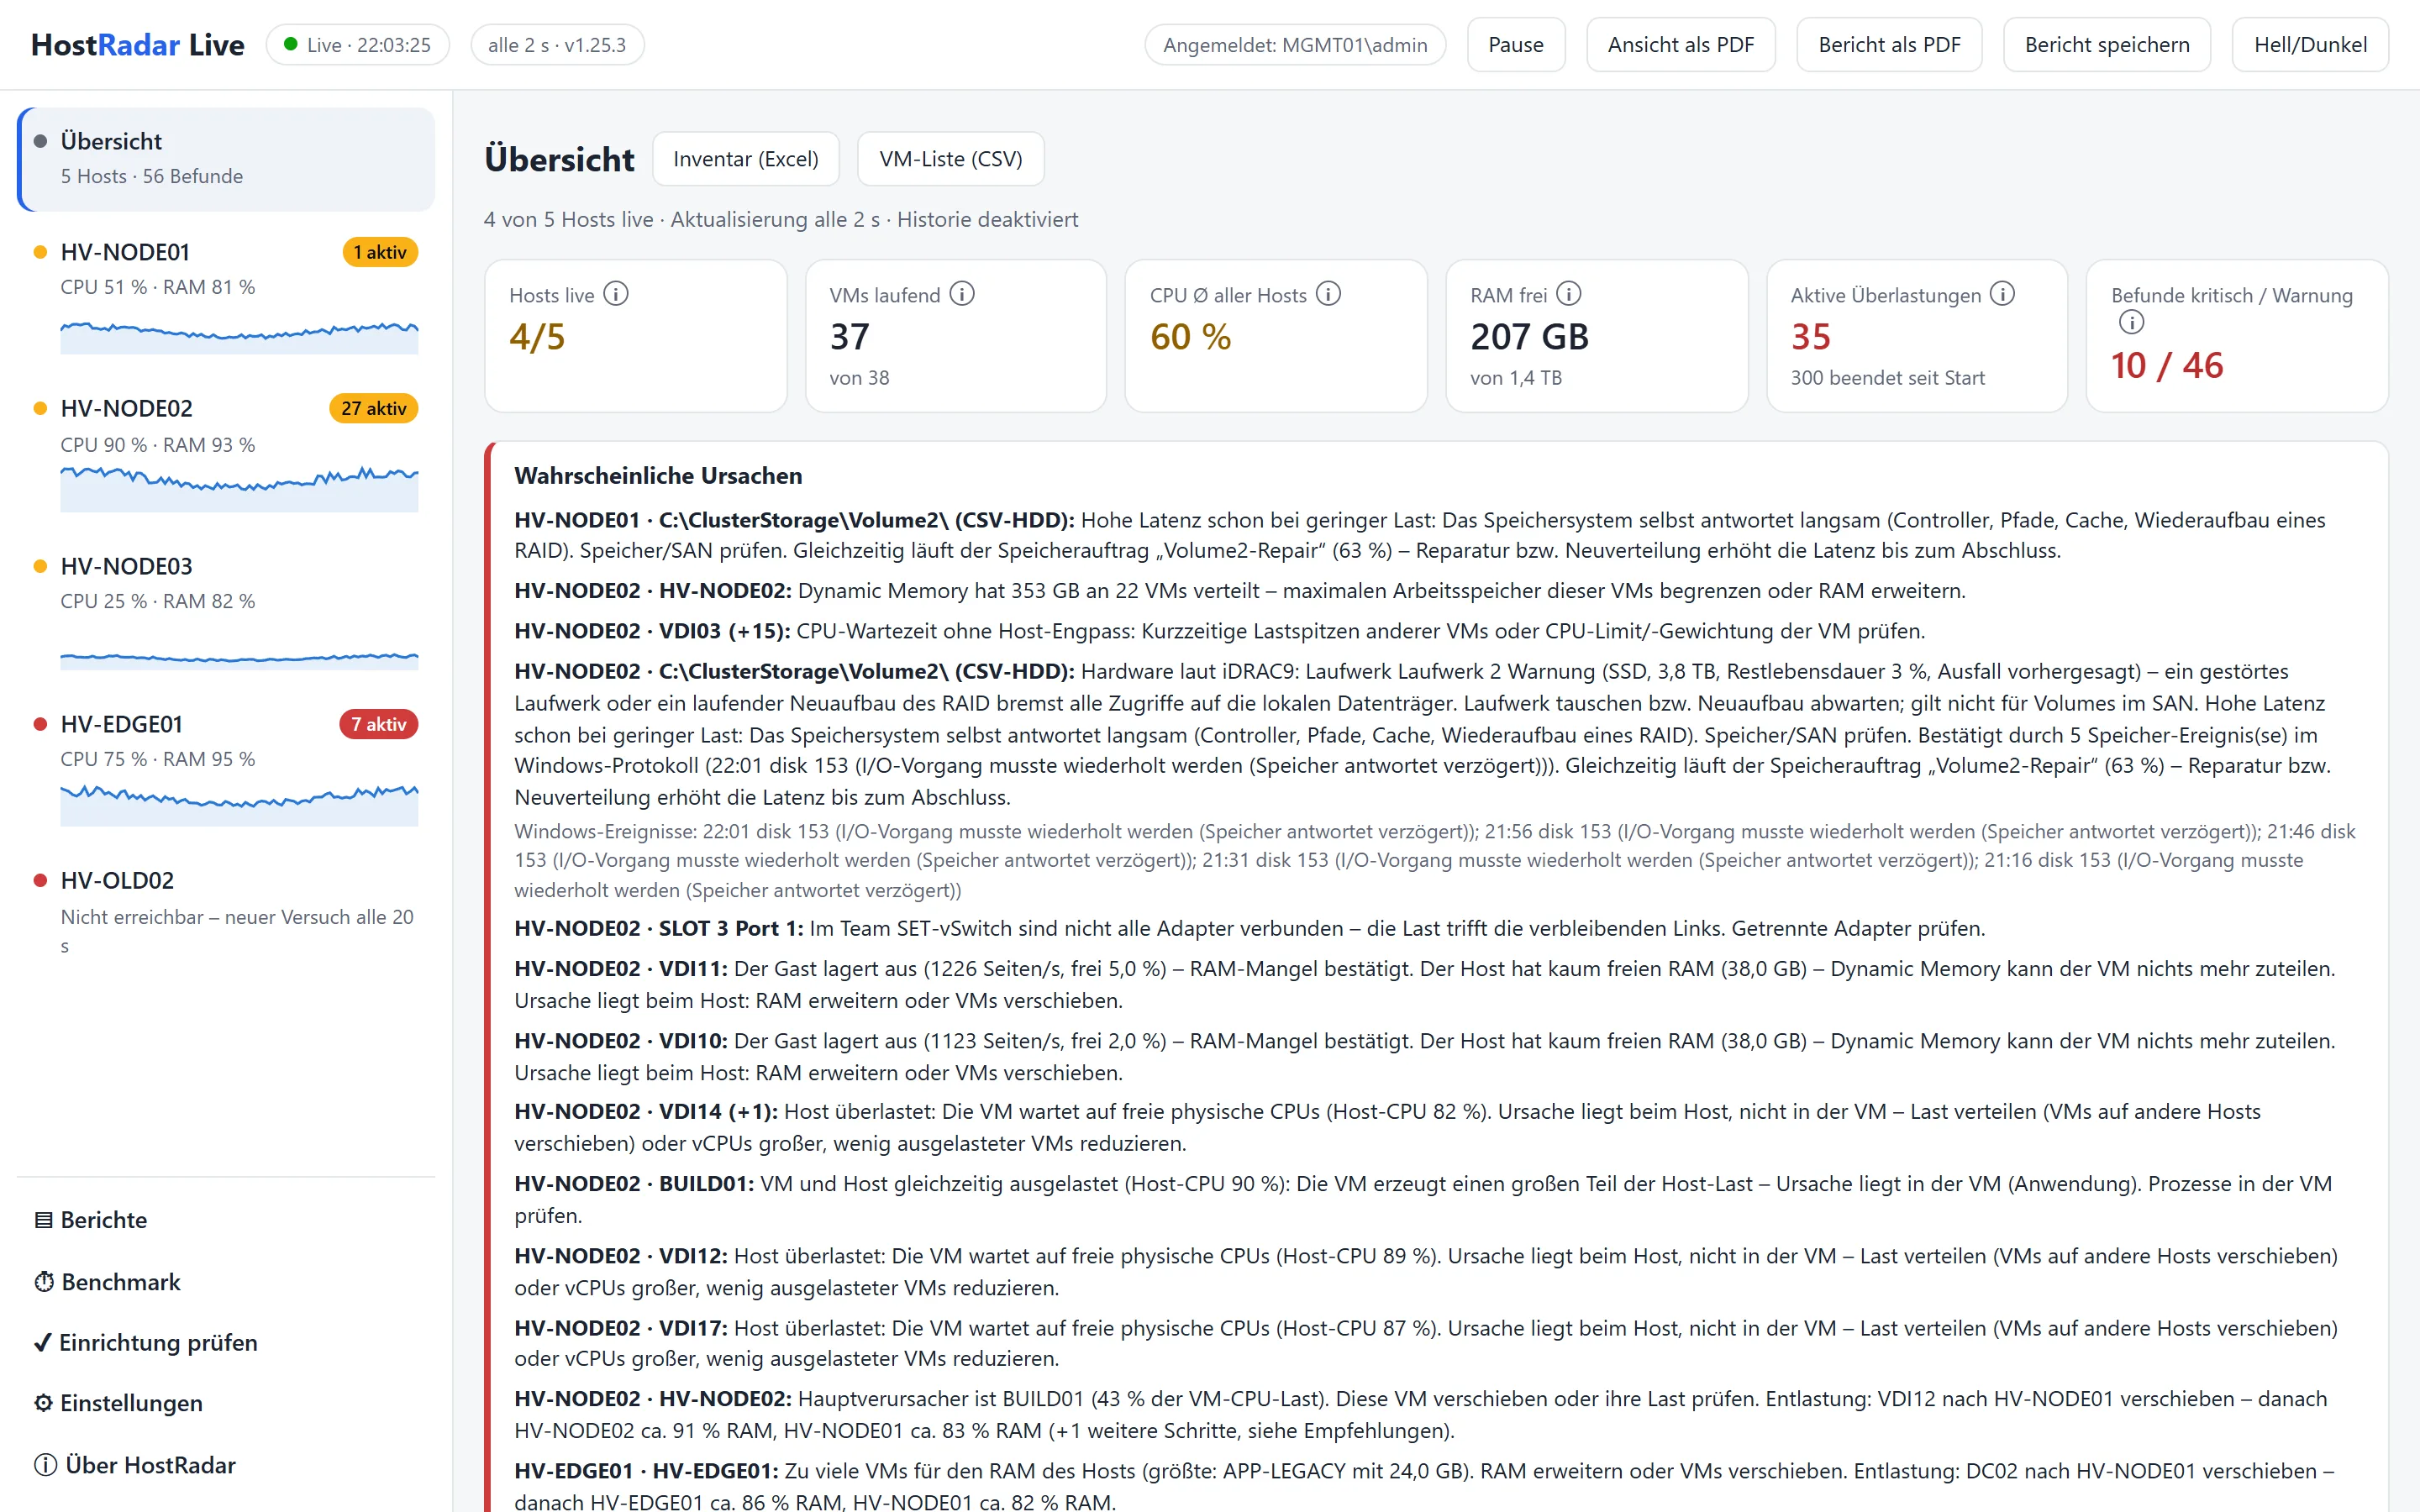
The live dashboard in your browser: every host on the left, the overall picture on top, the probable causes in plain language below. It runs locally or as a Windows service on your network – with Windows sign-in and HTTPS.

HostRadar overview in light mode with five hosts, key figures and probable causes
Captured in demo mode (HostRadar.exe --demo) with simulated hosts. The interface itself is in German.

From overload to cause – and to the next step

Other tools show charts. HostRadar follows the path further, until there is an action at the end of it.

  1. Measure

    Via WMI, straight from the Hyper-V counters: real hypervisor load instead of the Task Manager value, CPU wait time per VM (≈ CPU Ready), memory demand inside the guest, latency per volume and disk, network down to TCP connections.

    VDI03 · CPU wait 414 µs · threshold 200 µs
  2. Find the cause

    Host, VM, storage or network? HostRadar classifies every overload, can look inside the VM (processes, paging, sessions) and adds matching Windows events.

    Cause: CPU wait without host bottleneck – short load peaks of other VMs
  3. Read the recommendation

    Every finding ends in a target value: which VM, how many vCPUs, how much RAM, where to move it – and what the load looks like afterwards.

    8 vCPUs, avg 4 % load → reduce to 2

What HostRadar checks for you

Spot overloads before anyone calls

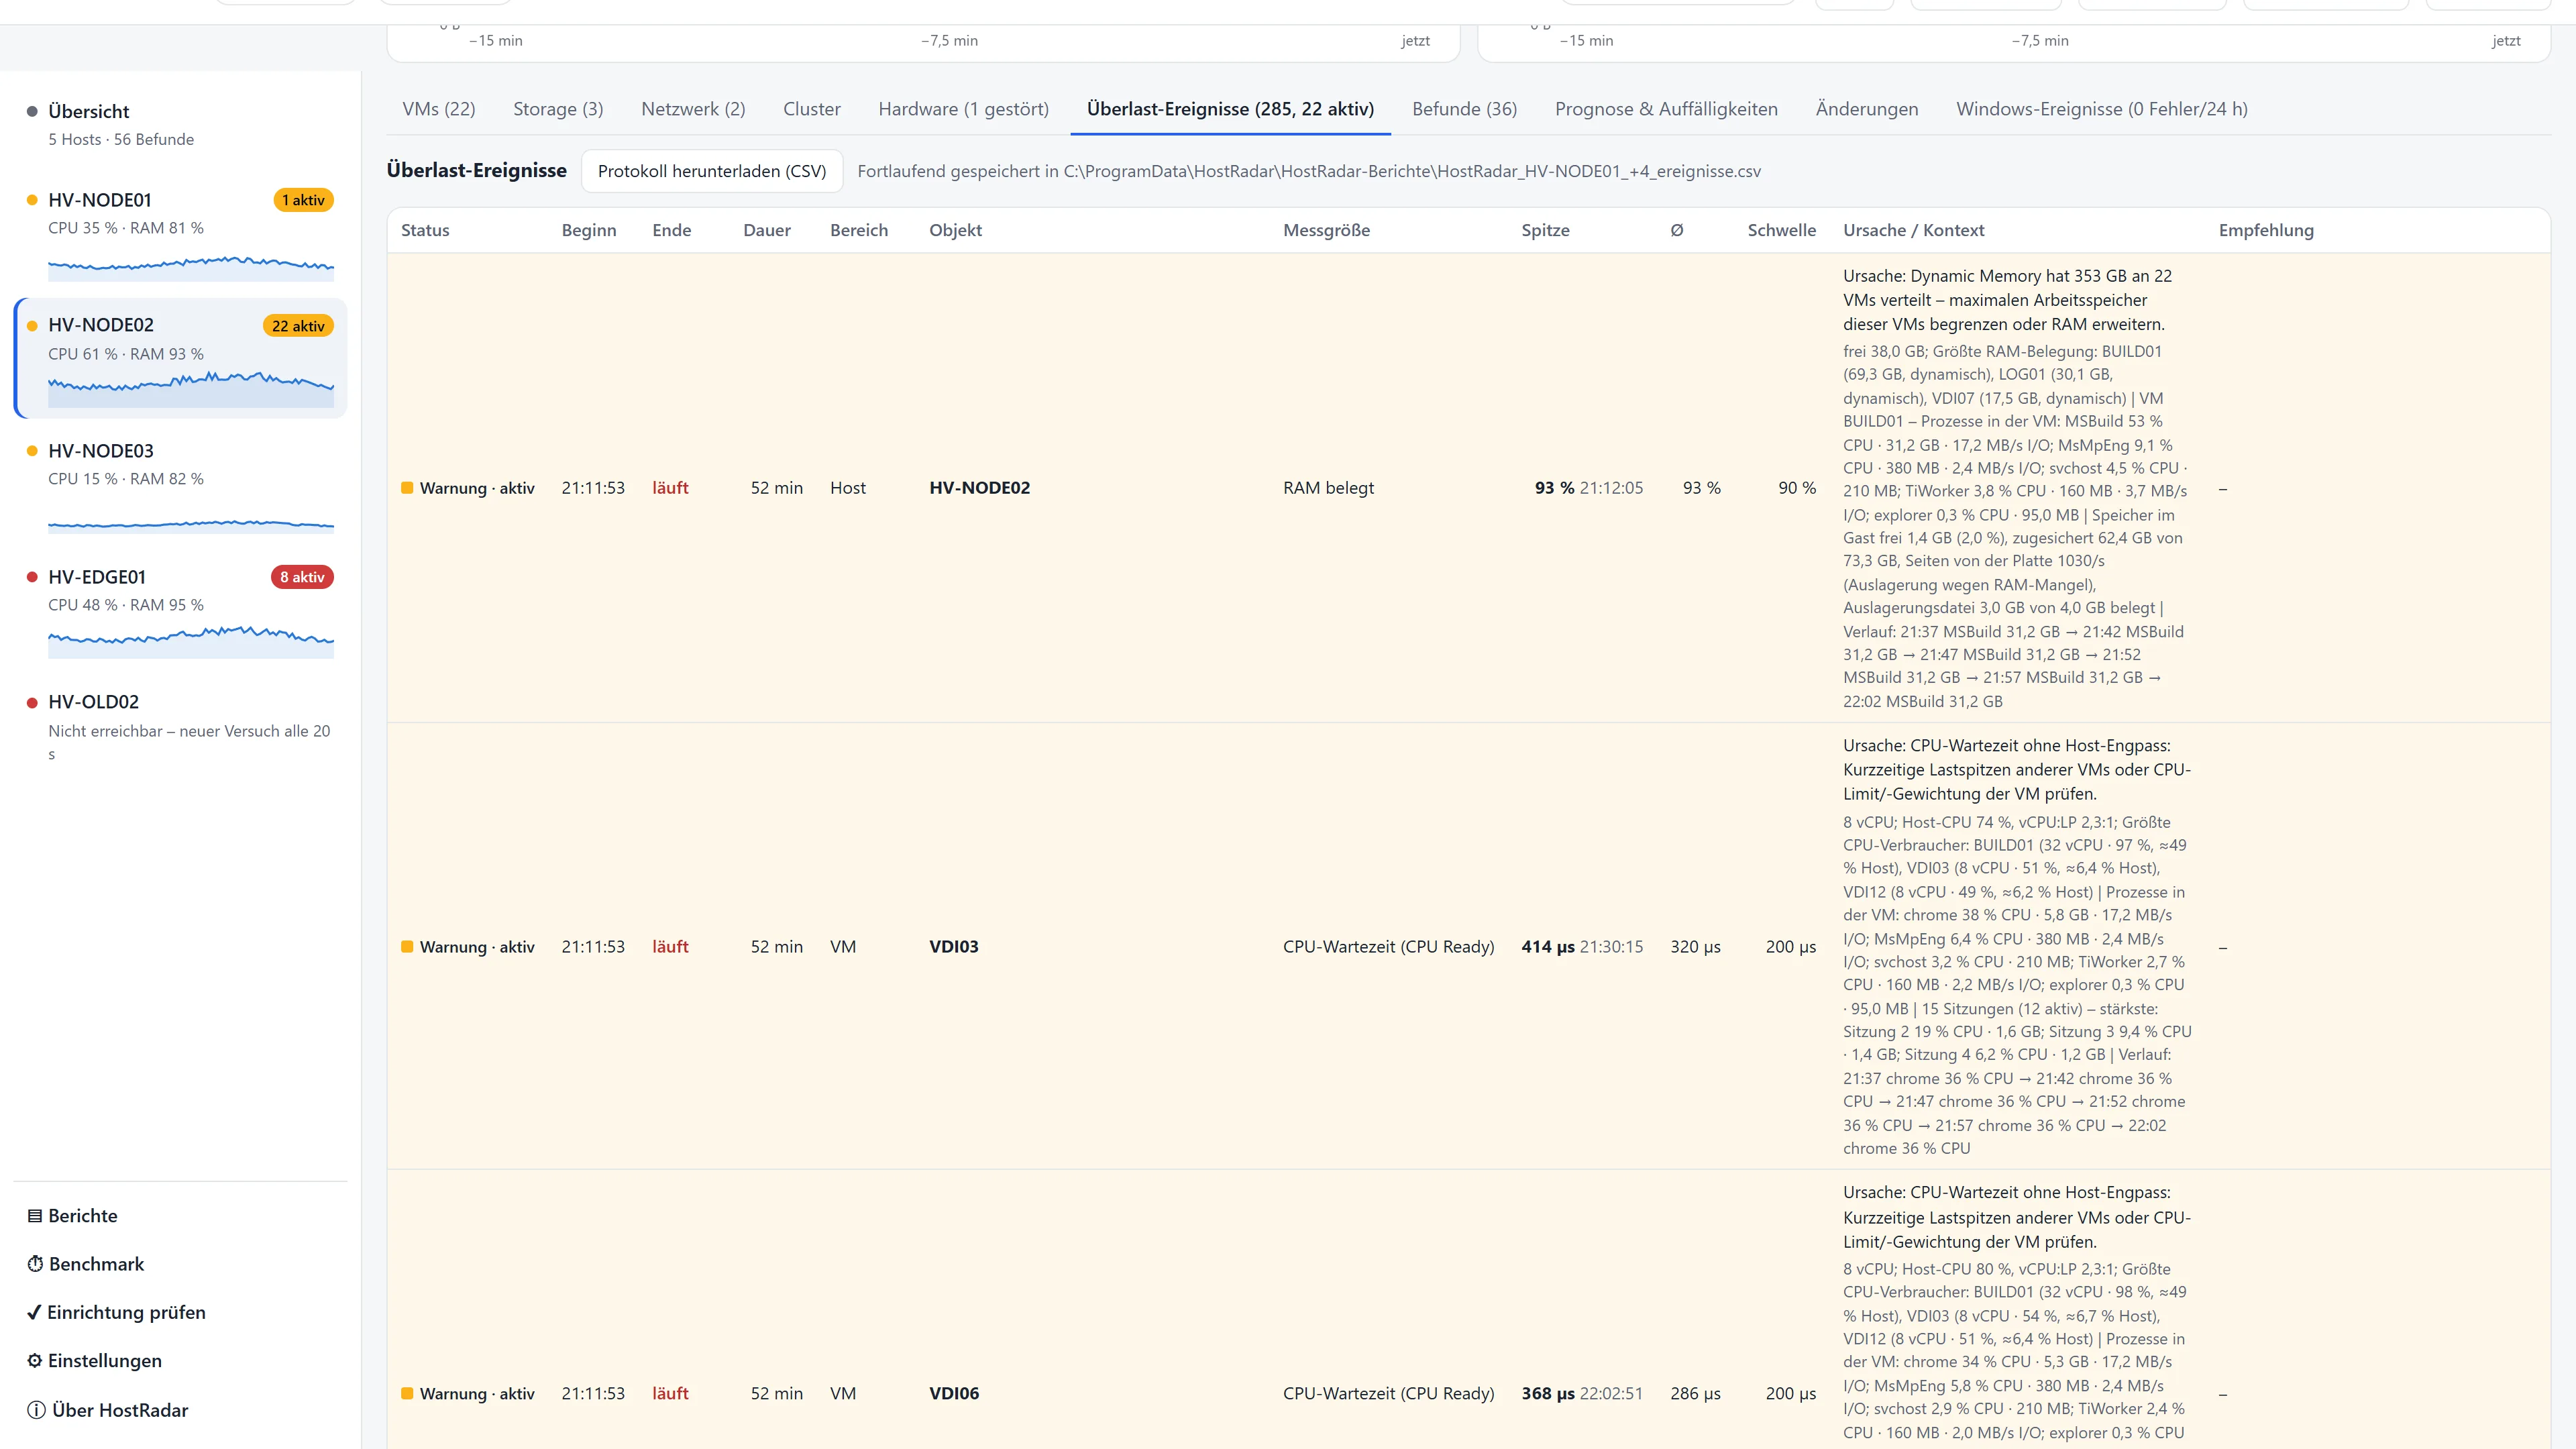
In live operation HostRadar logs every overload with start, duration, peak and the culprit – “critical” only once the value has stayed above the threshold for a while.

  • Event log with cause, context and recommendation, as CSV and in the history
  • Notifications by e-mail and Microsoft Teams, with quiet hours and reminders
  • Maintenance windows and acknowledgement, so planned work does not raise alarms
Overload events of a host with status, peak, threshold and cause
Overload events with cause and context

Findings with a target value

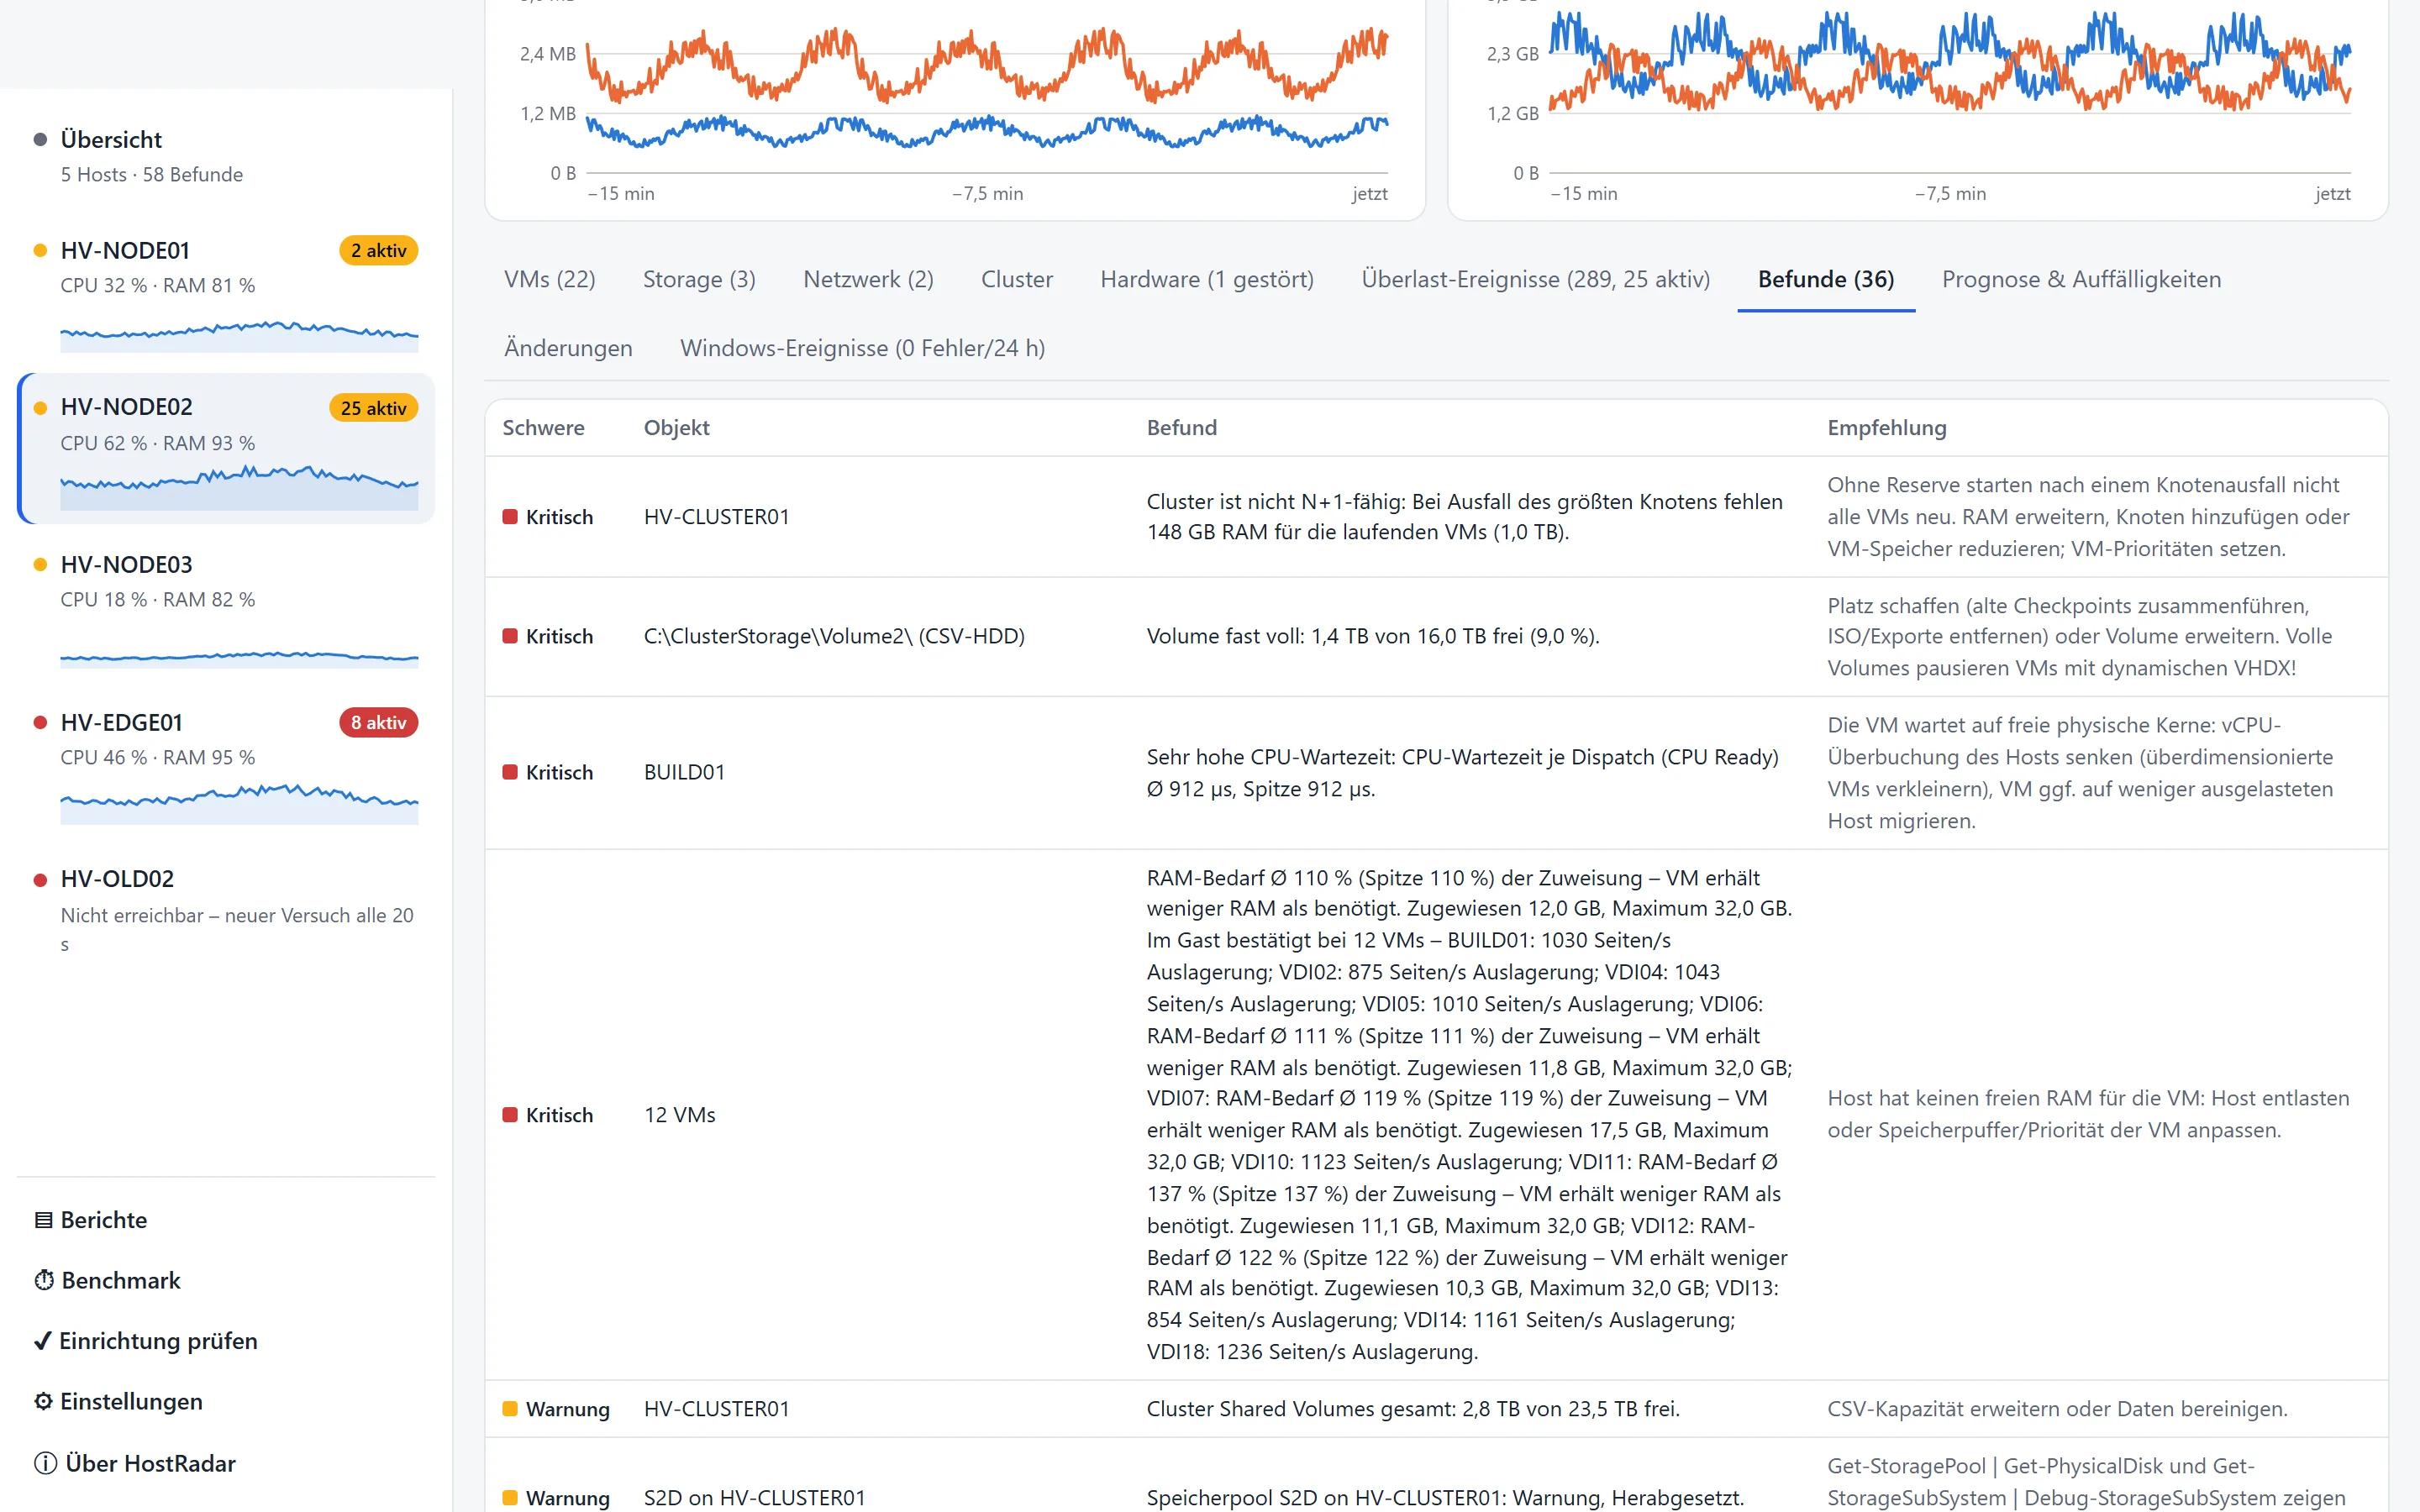
More than 130 checks for CPU, RAM, storage, network, clusters and configuration. Each one names the measurement, the cause and what to do.

  • Too many or too few vCPUs, with a target derived from the P95 rather than a single spike
  • Static or dynamic memory depending on the role – never Dynamic Memory for Exchange
  • Volumes nearly full, old checkpoints, orphaned differencing disks, over-committed thin provisioning

“Exchange: increase static RAM from 8.0 GB to at least 20.0 GB – do not switch to Dynamic Memory.”

Findings of a host with severity, object, finding and recommendation
Findings with recommendation

Look inside the VM – without an agent

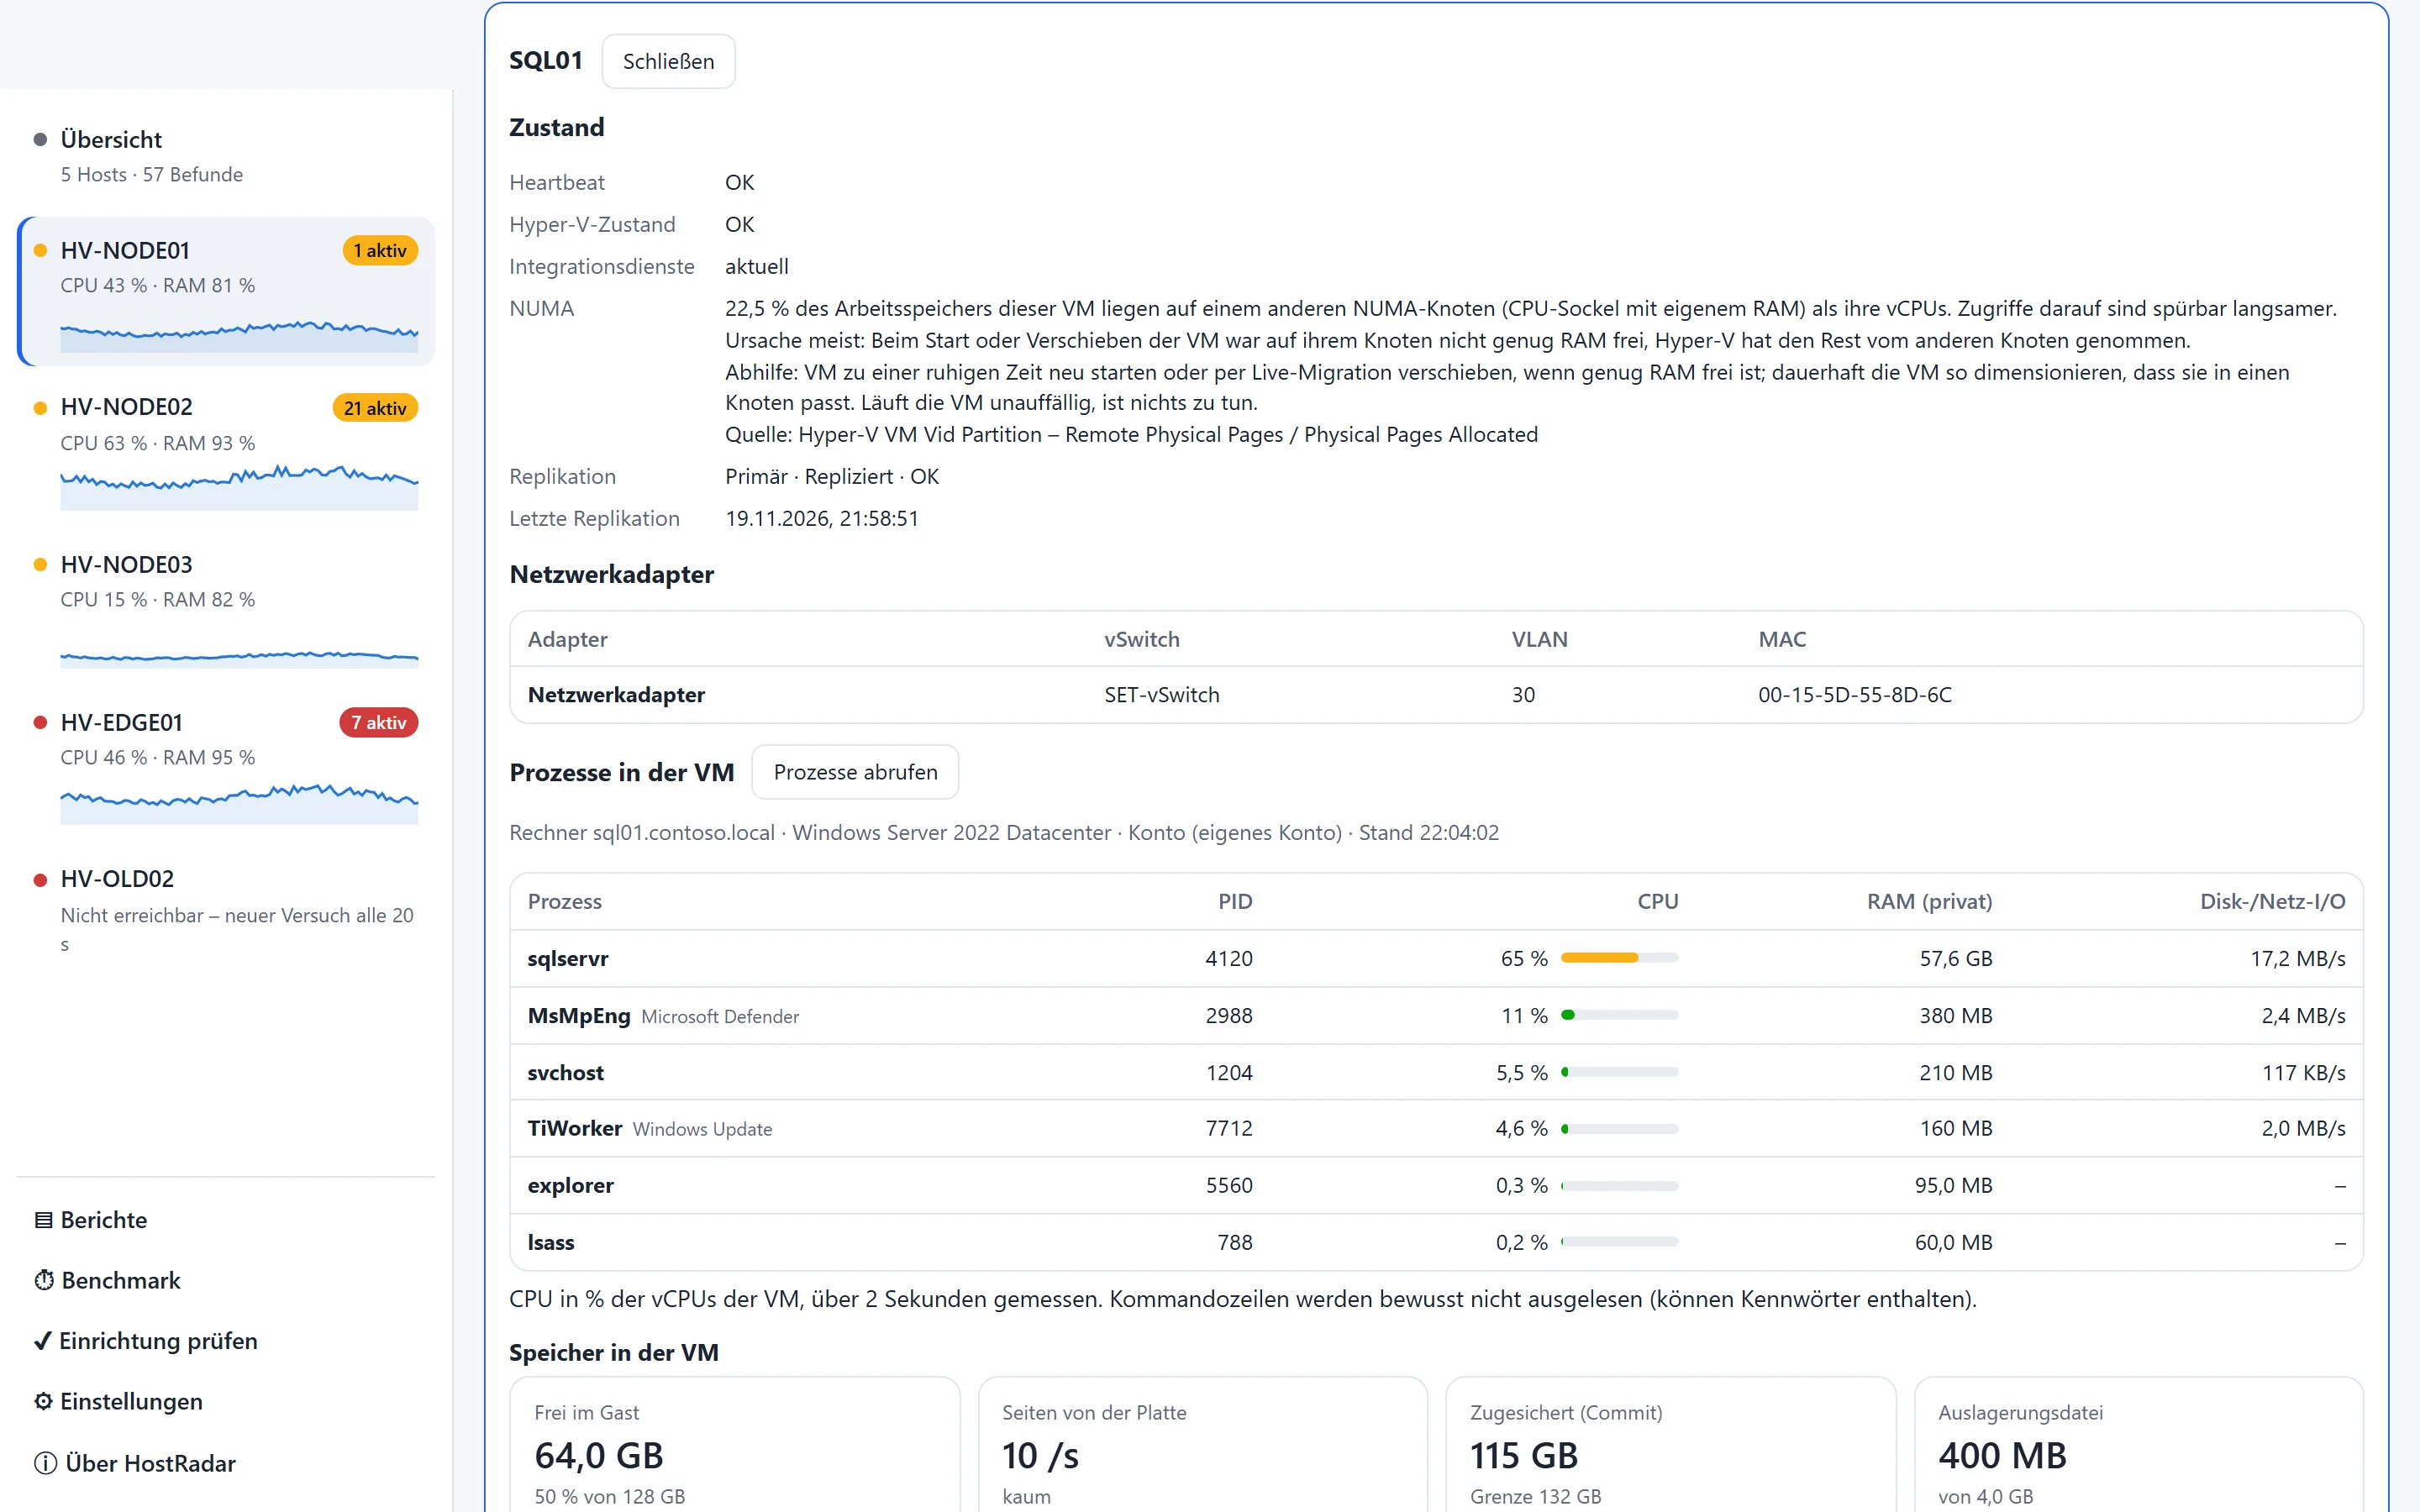
When an overload occurs, HostRadar queries the processes in the guest (Windows via WMI, Linux via SSH key) and recognises the application: Exchange, SQL Server, domain controller.

  • Top processes with CPU, RAM and I/O, paging in the guest, terminal server sessions
  • Known culprits such as virus scanners, Windows Update, backup and indexing
  • User experience on terminal servers: input delay per session, RDP graphics, GPU
VM detail view with state, network adapters and processes in the guest
VM details with processes in the guest

History, forecast and baseline

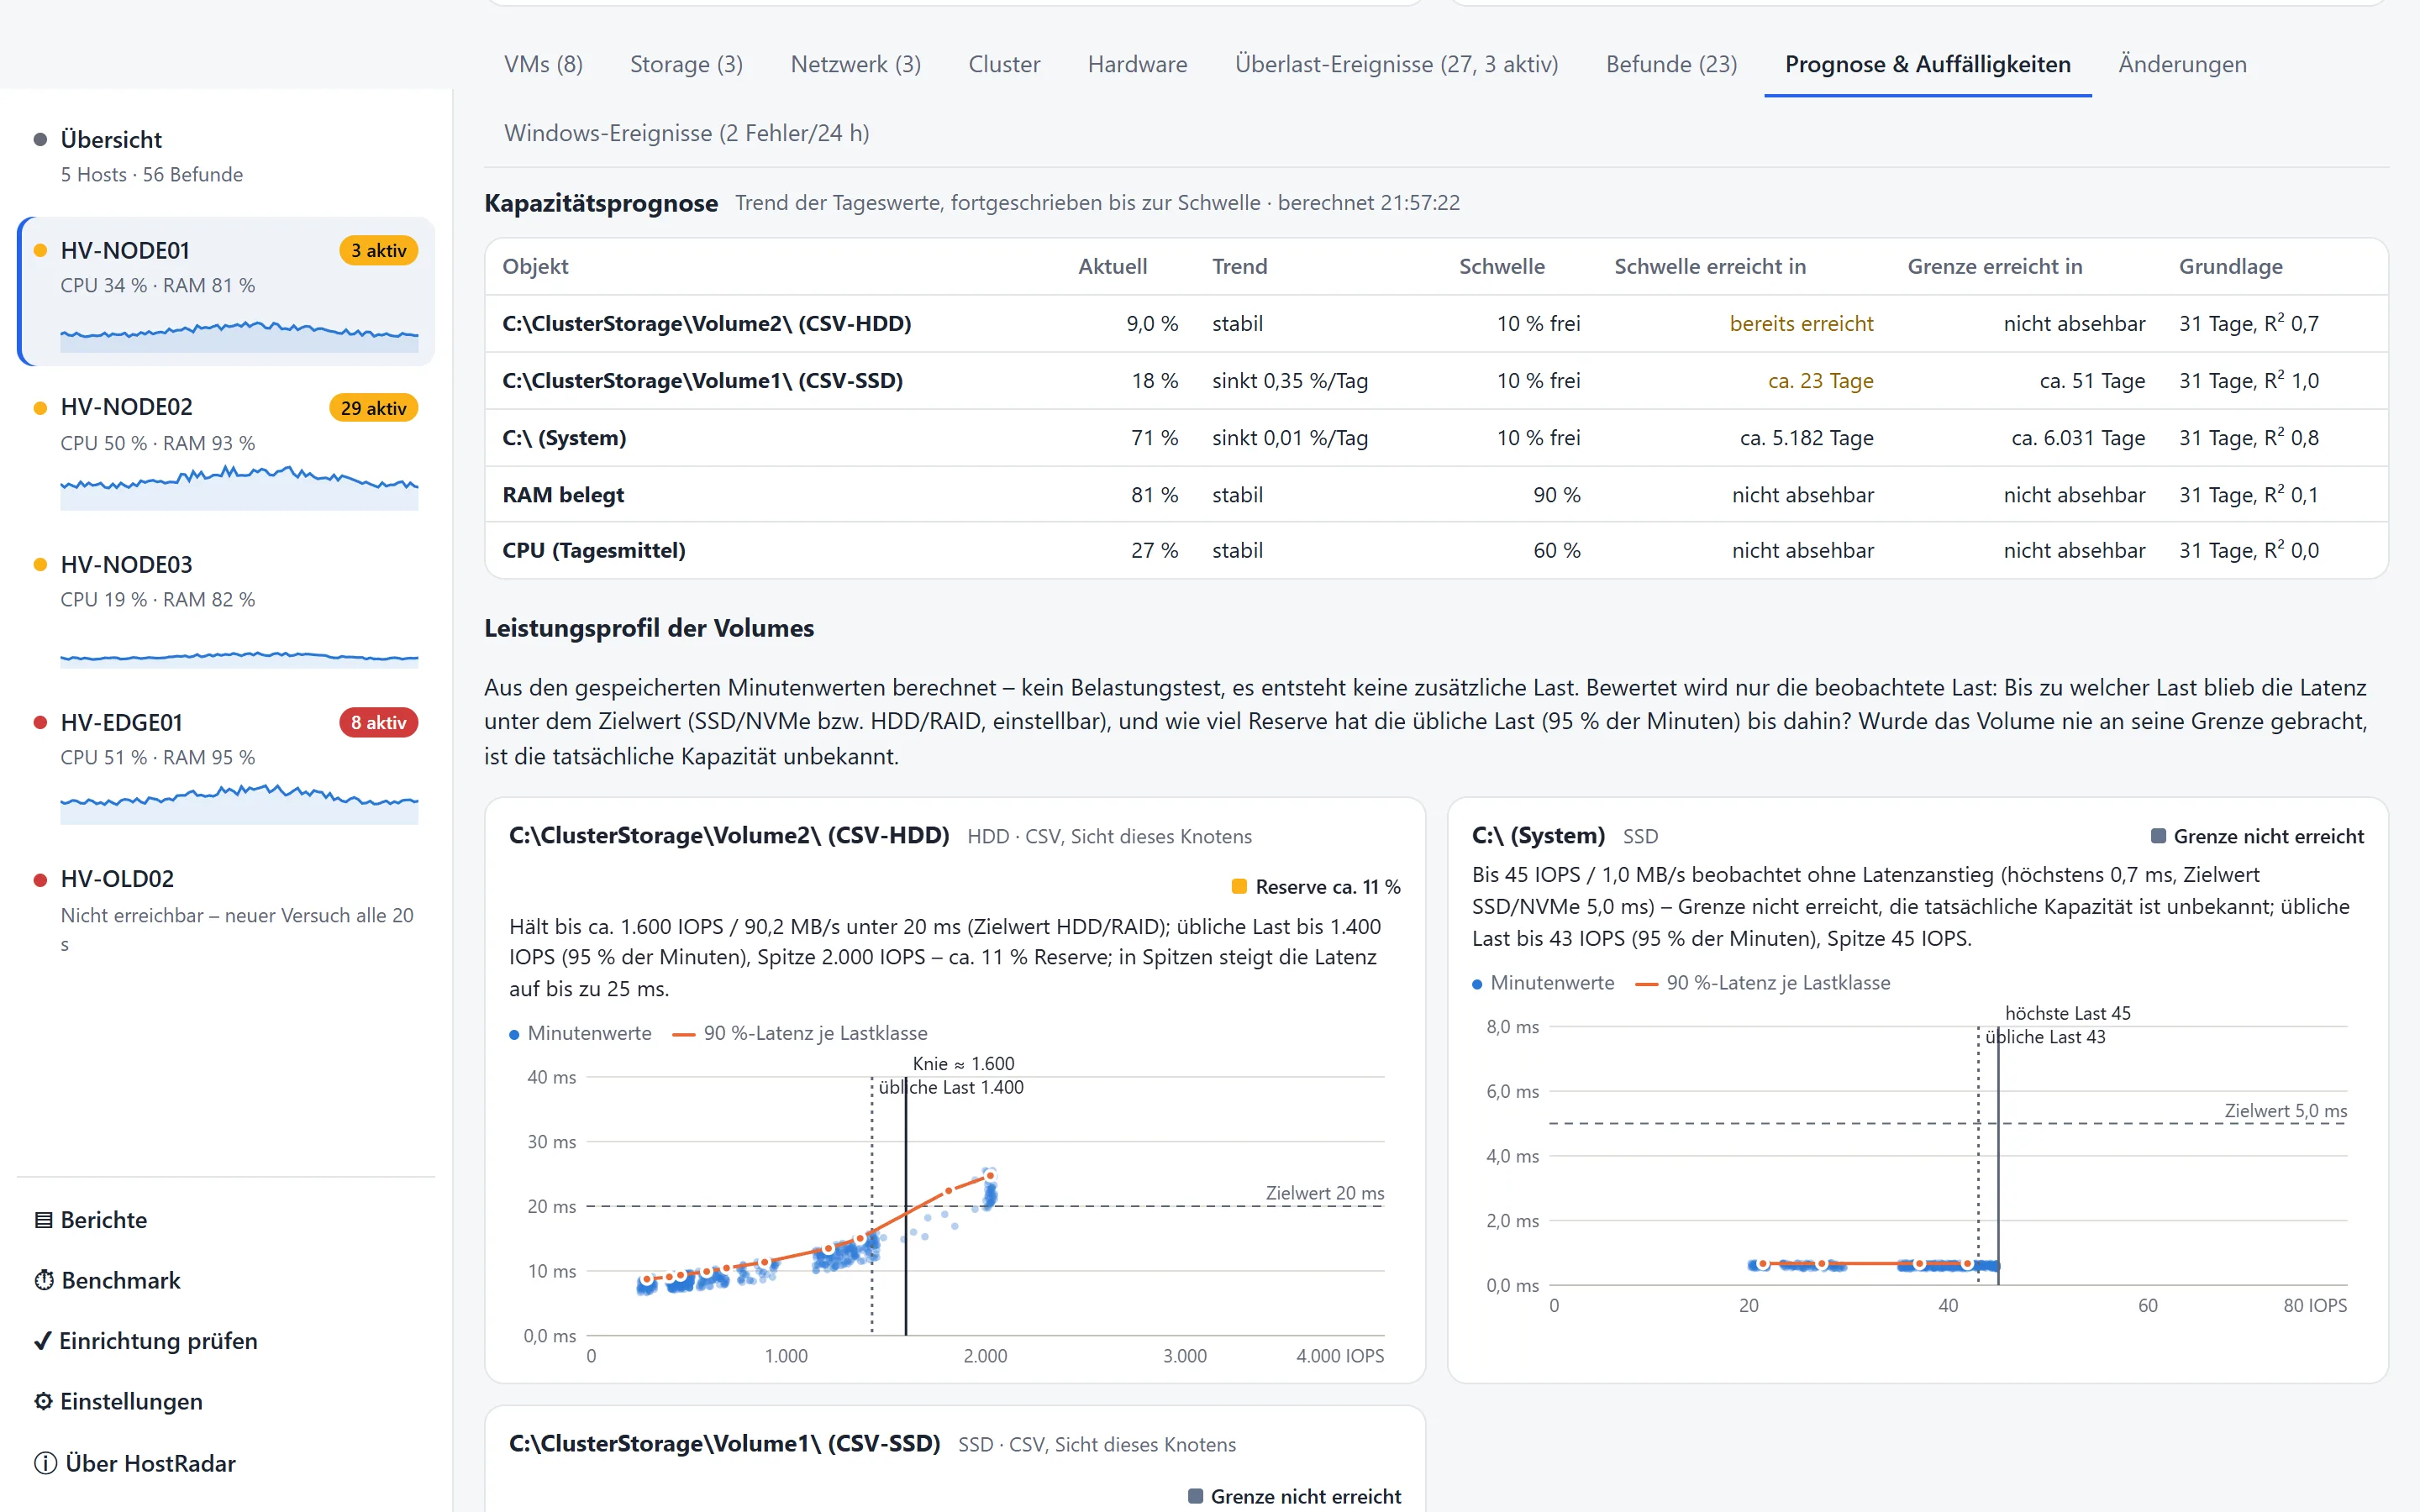
Running as a service, HostRadar keeps per-minute values for weeks and months – and works out when capacity will run short.

  • Capacity forecast for volumes, host RAM and host CPU
  • Baseline per weekday and hour: “CPU of VM X unusually high (normally 8 %)”
  • Idle VMs over 30 days, performance profile per volume, comparison with the previous period

“Volume below 10 % free in about 23 days.”

Capacity forecast and performance profile of the volumes
Forecast and performance profile per volume

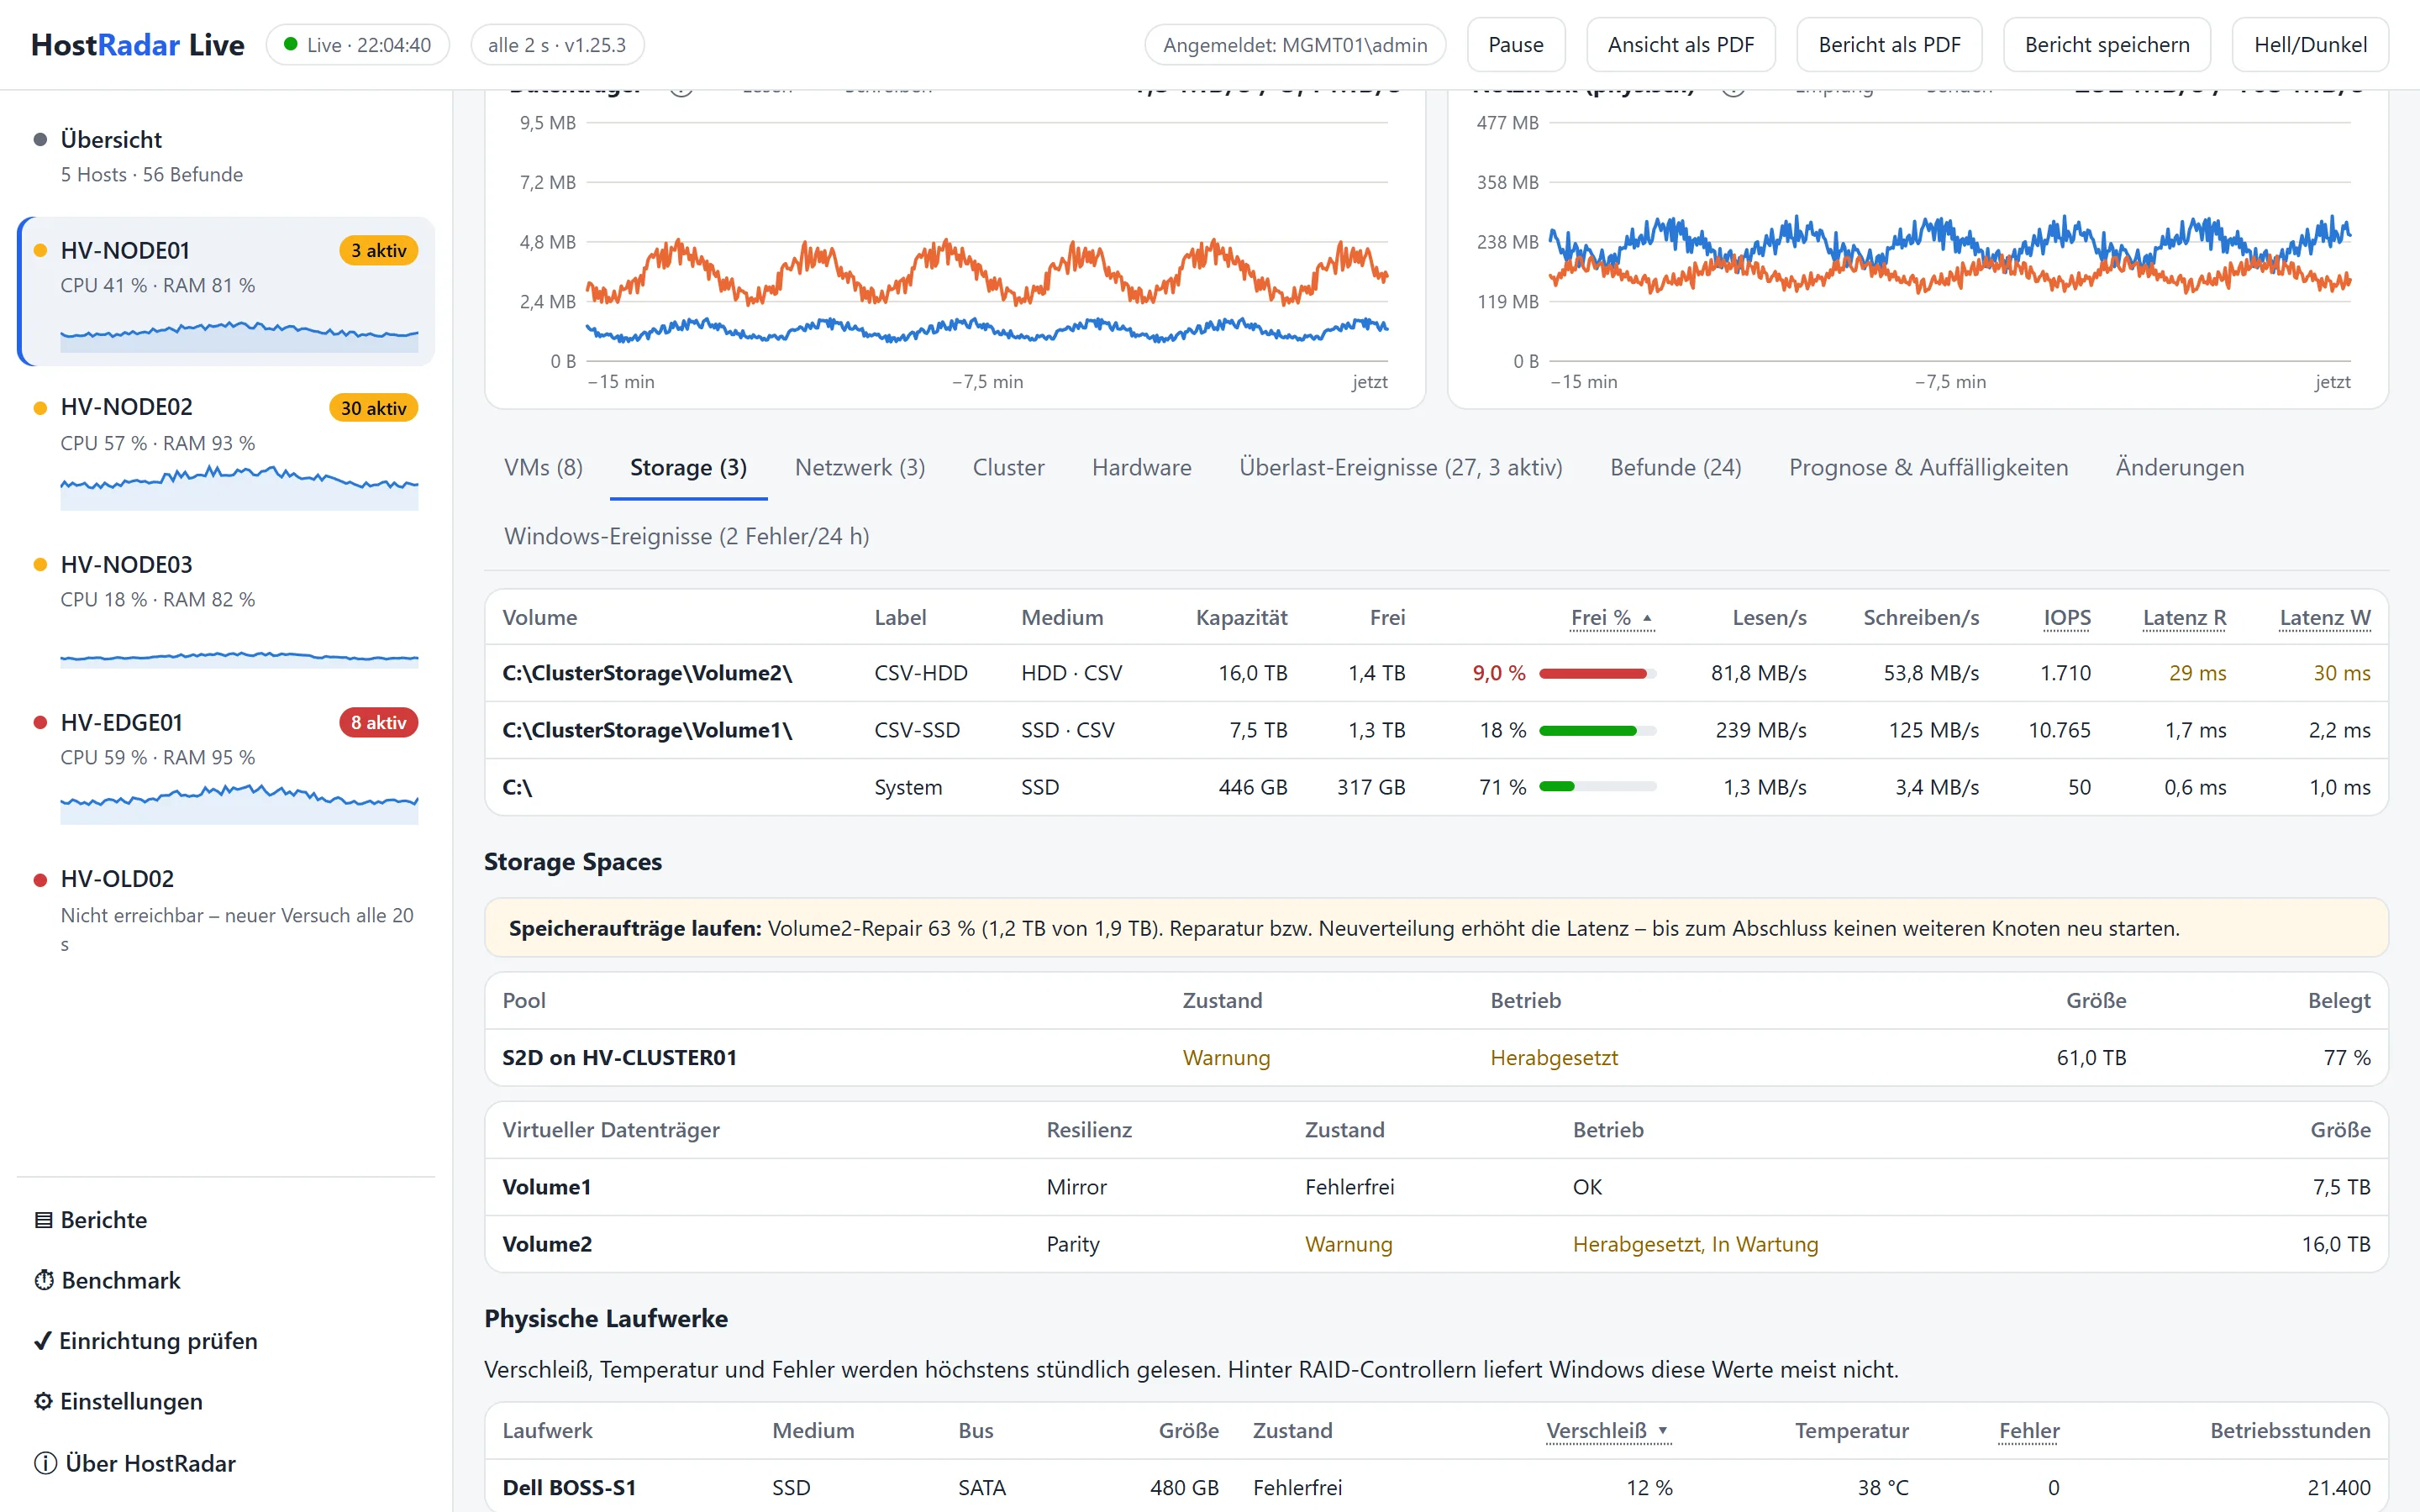
Storage, network and clusters

From CSV to NIC teams: HostRadar sees the layers where VMs slow down, even when the host itself looks fine.

  • CSV in redirected mode, Storage QoS limits, SMB latency per share, MPIO paths
  • SET and LBFO teams, VLANs, VMQ/RSS, individual overloaded cores
  • N+1 capability of the cluster, state of nodes, roles, networks and Storage Spaces Direct
Storage view with volumes, latency, IOPS and Storage Spaces
Storage with volumes and Storage Spaces

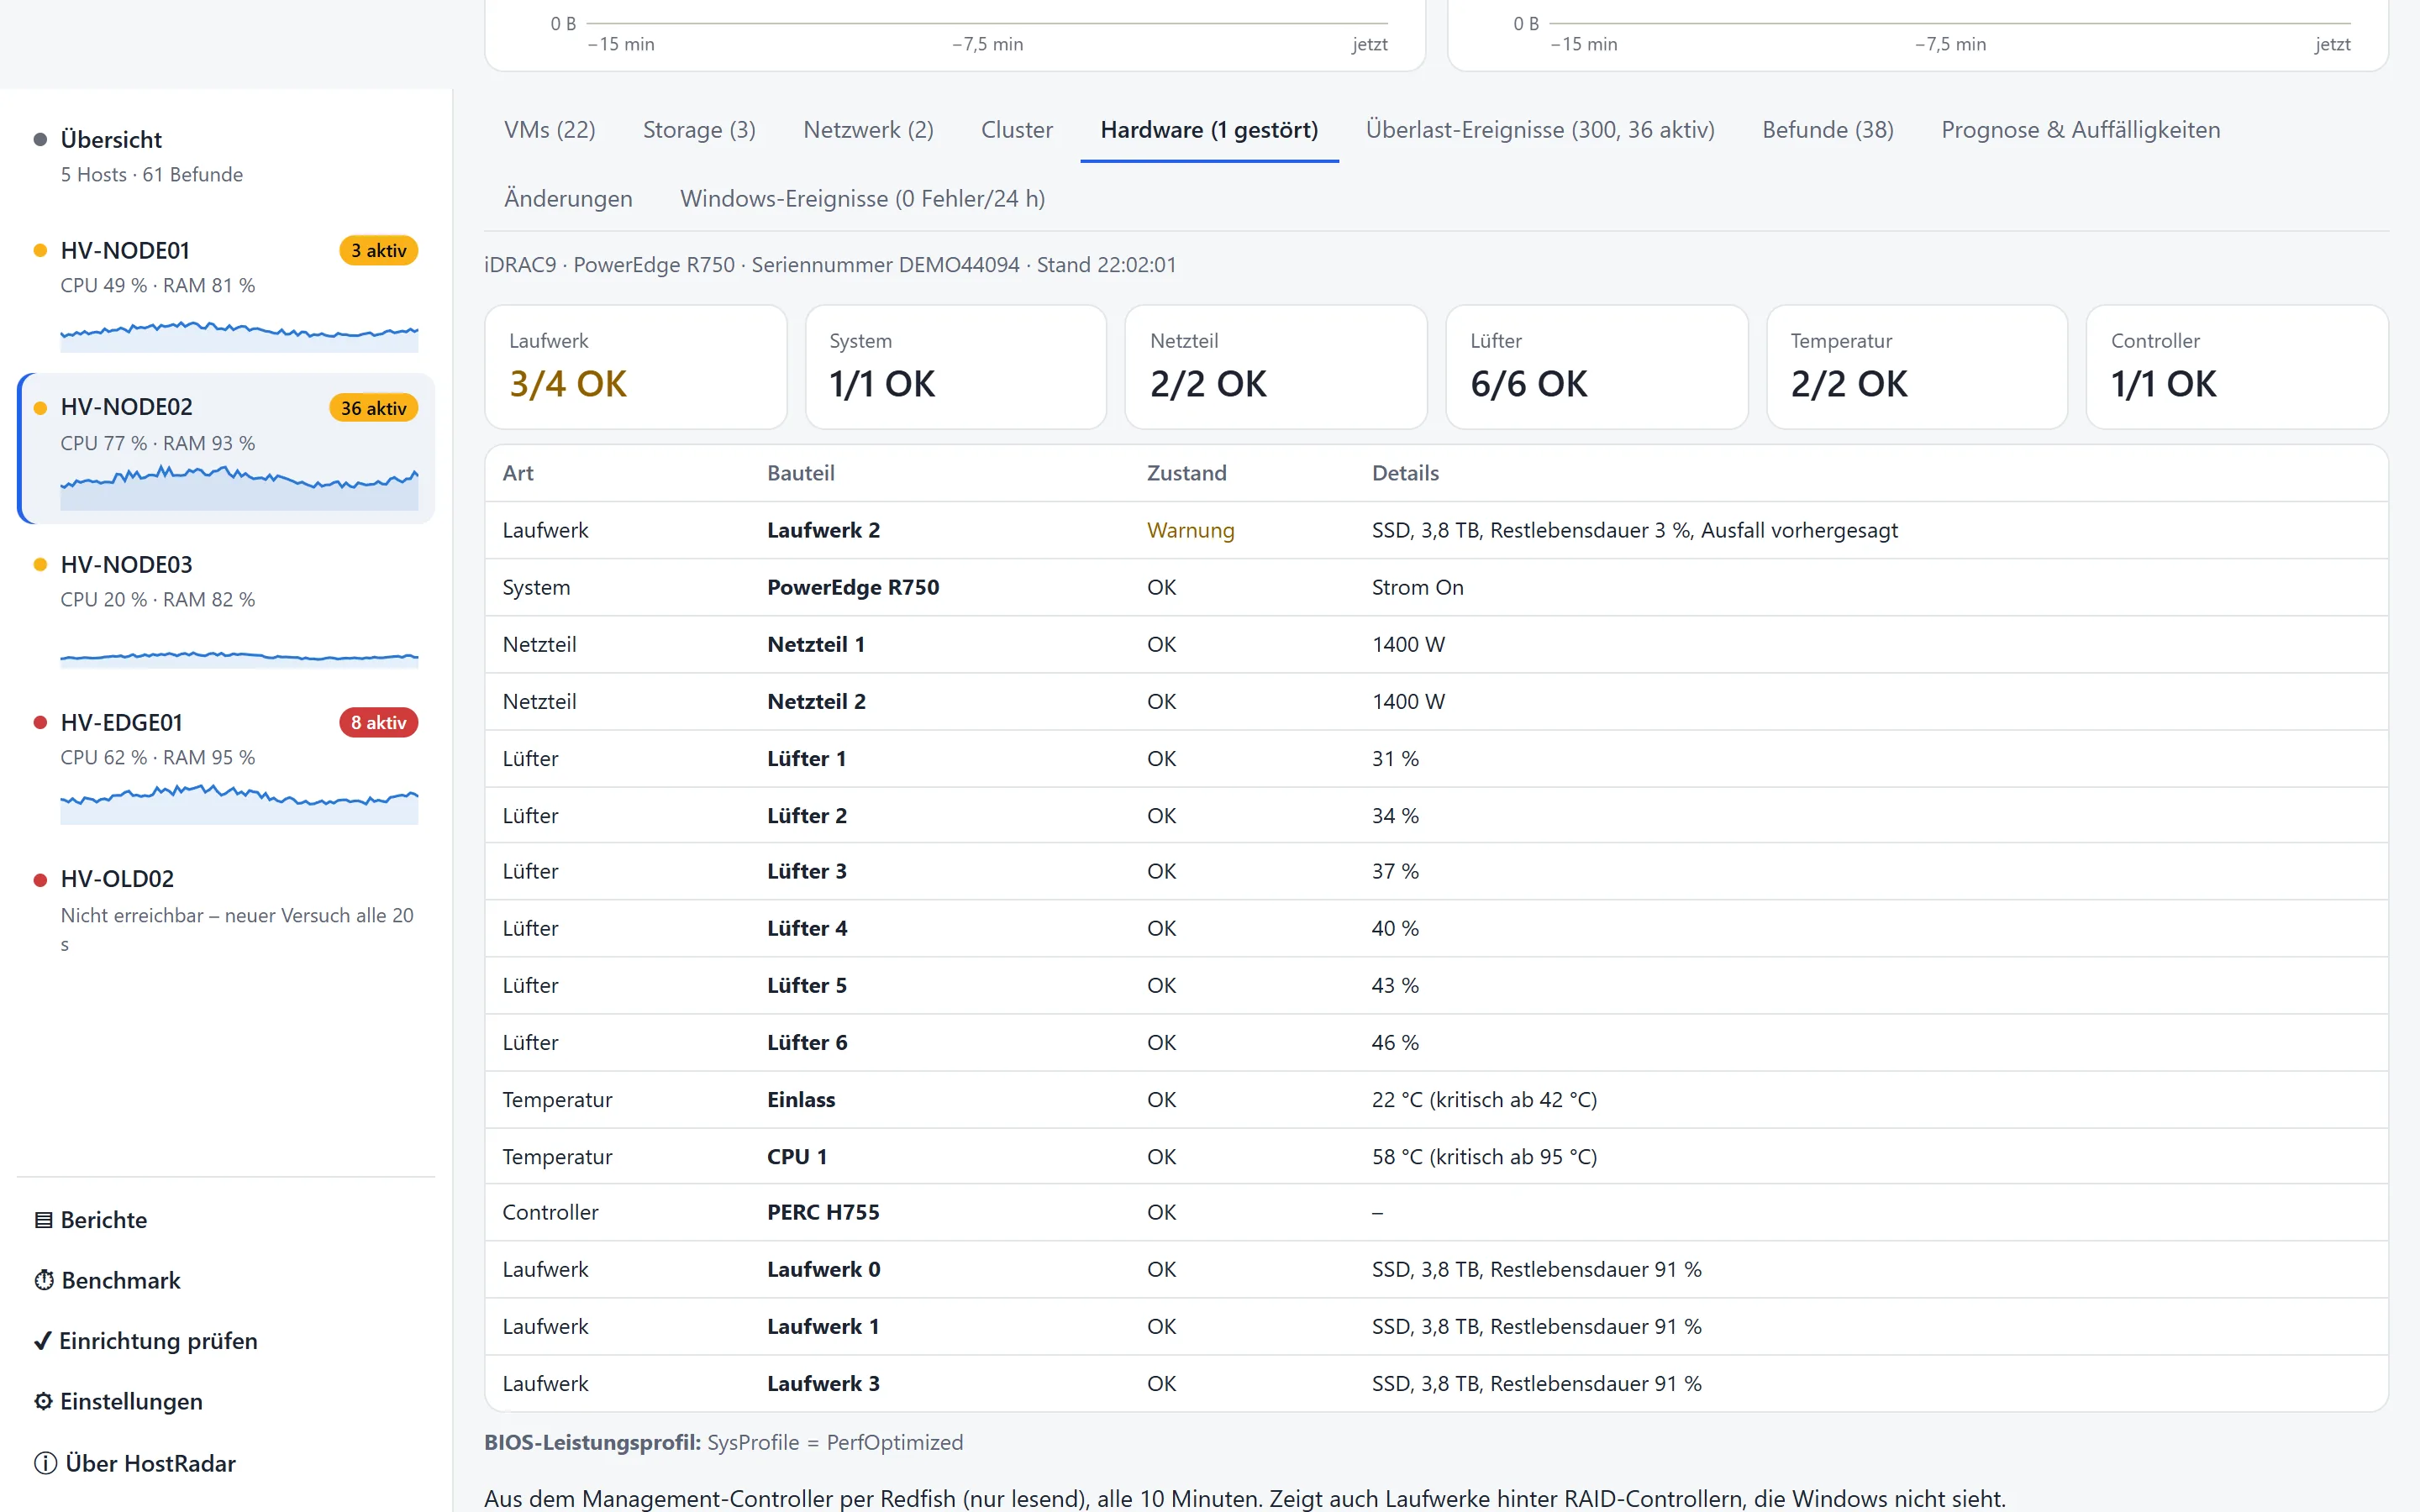
Hardware, setup and benchmark

HostRadar also checks what sits underneath the hosts – and whether they are set up correctly.

  • iLO/iDRAC via Redfish: power supplies, fans, temperatures, RAID controllers, drives
  • “Check setup” per host, with the matching command to copy
  • Storage benchmark on the host and inside the VM, with host ↔ VM comparison and baseline

“WTS1 reaches only 31 % of the host volume’s performance on average.”

Hardware state of a host via iDRAC with power supplies, fans and drives
Hardware via Redfish

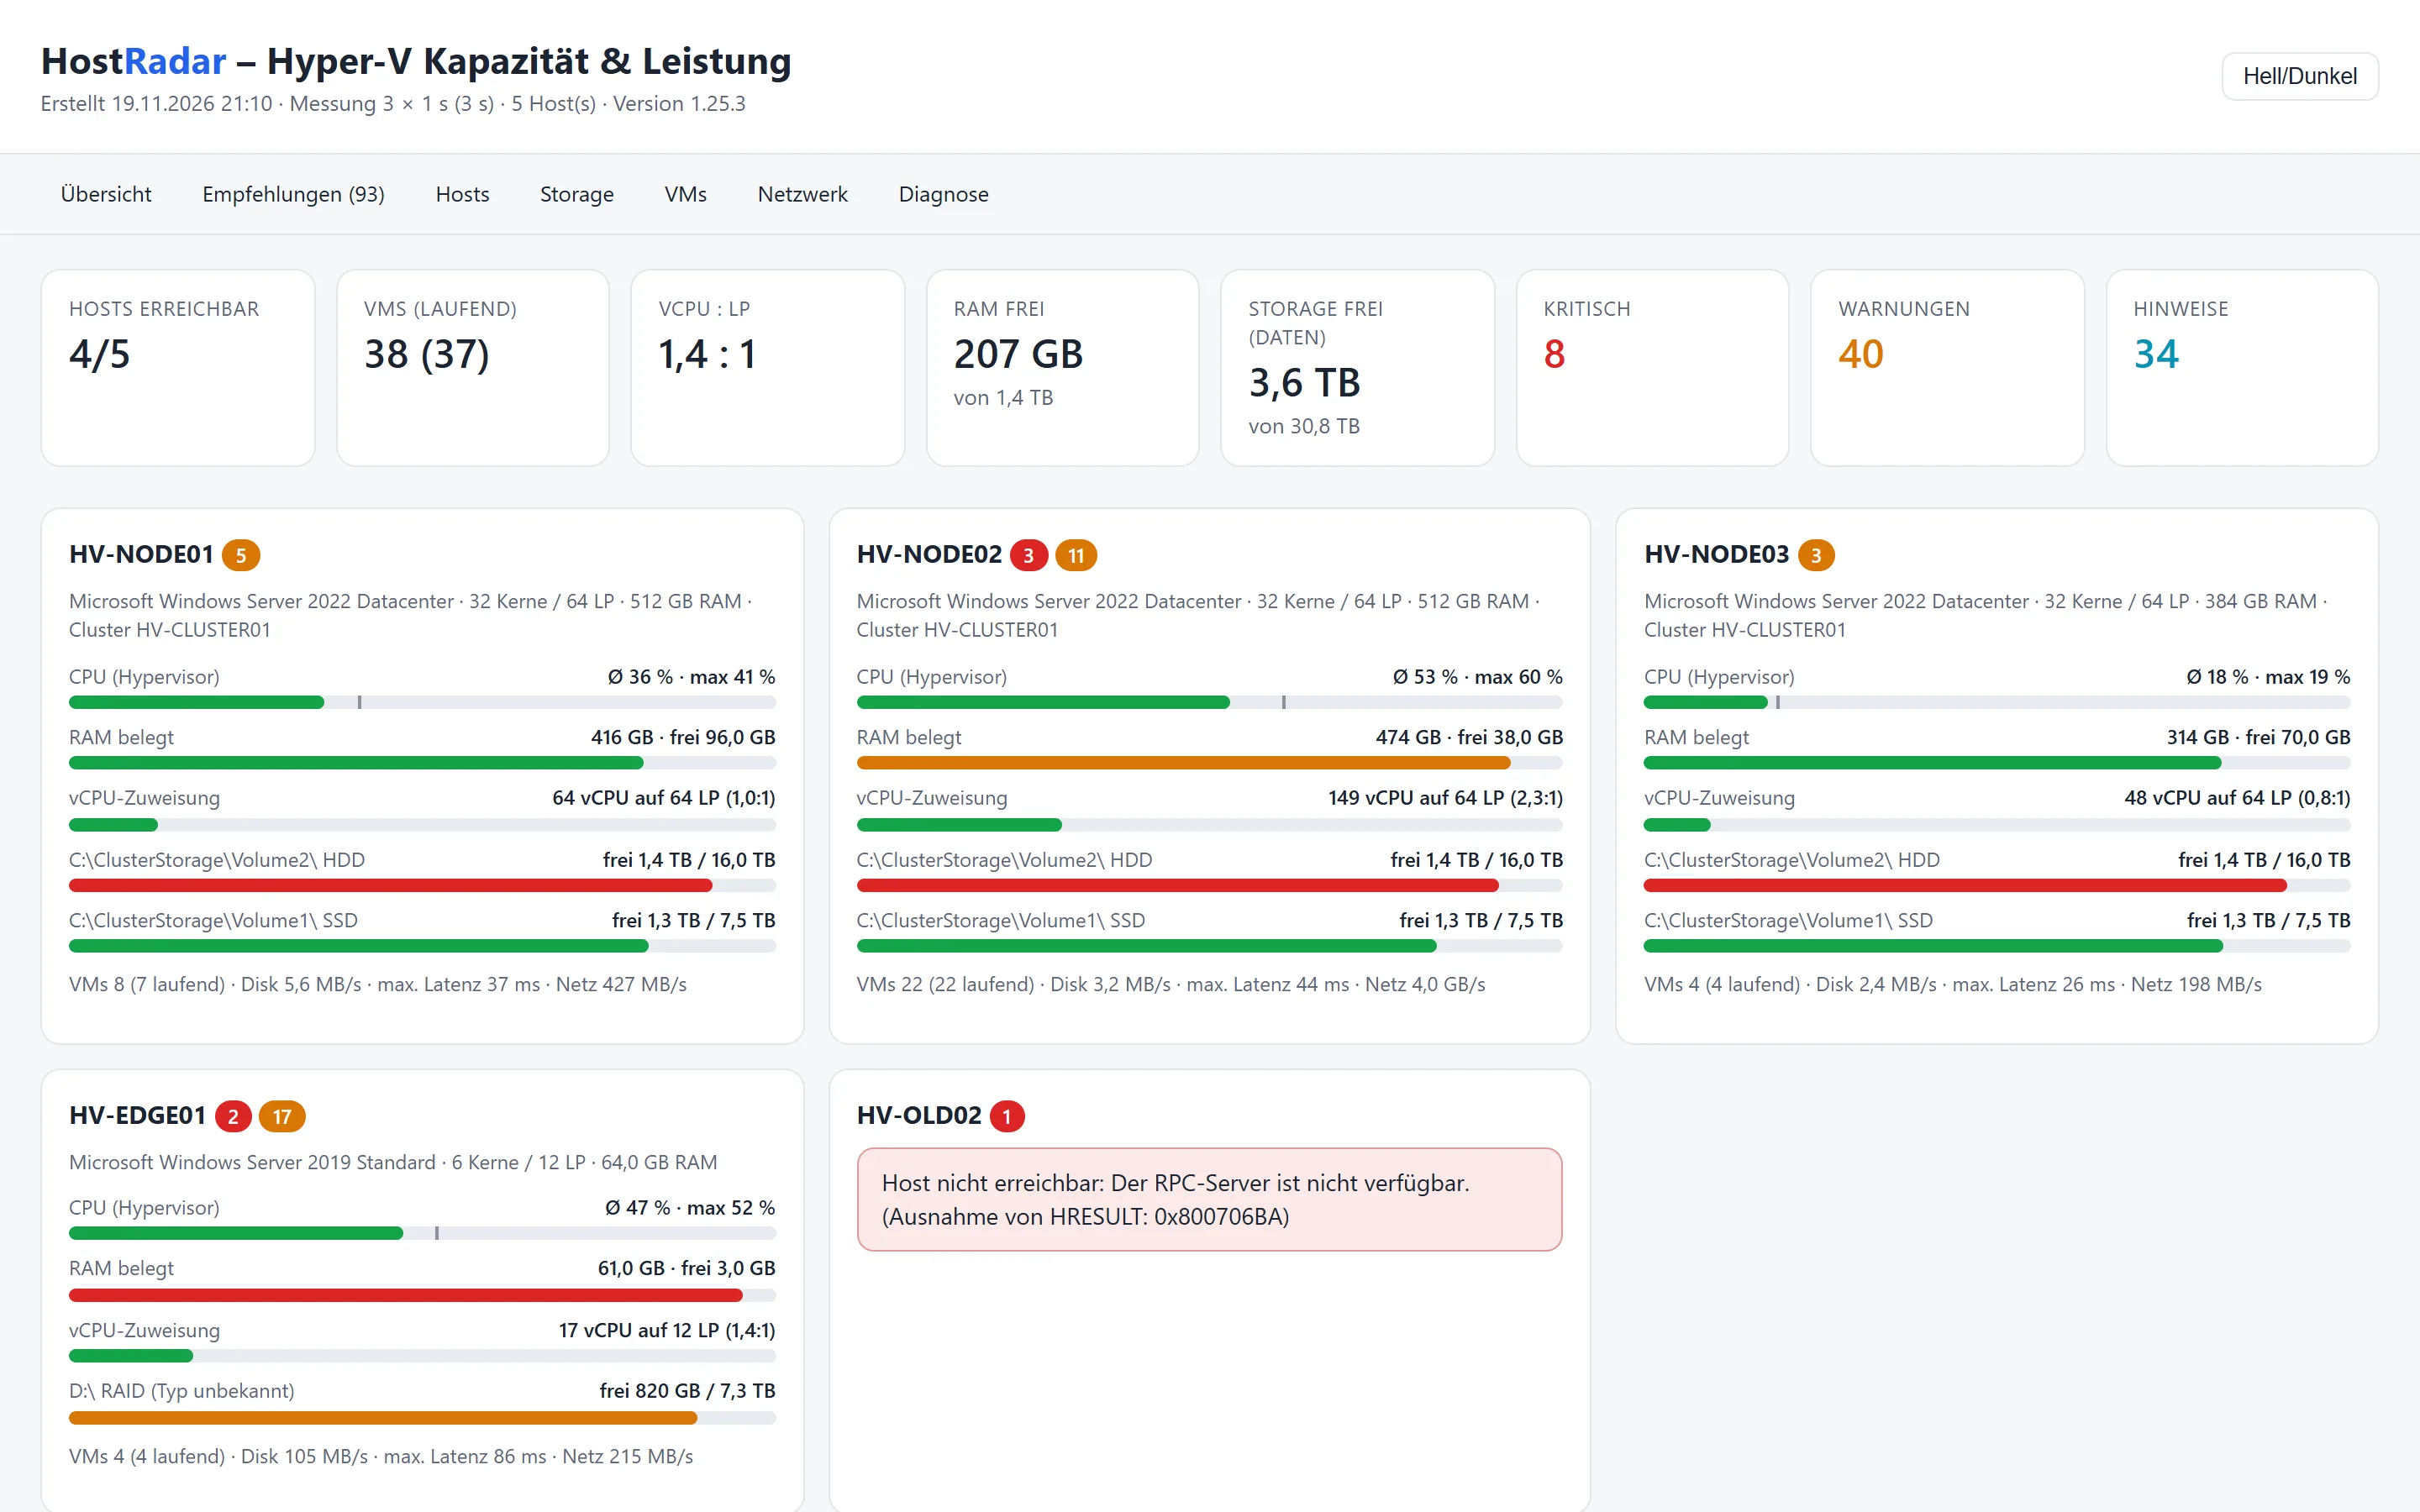
Reports for documentation and customer meetings

One run produces a self-contained report – light and dark, sortable and filterable – plus PDF, CSV and JSON.

  • Daily, weekly and monthly reports by e-mail, with customer name and your own logo
  • Inventory as Excel/CSV, change log, patch level and Windows Server licence estimate
  • Central overview of several HostRadar installations, tickets by e-mail or webhook
HTML report with an overview of all hosts and key figures
HTML report from HostRadar.exe --demo

Every feature at a glance

What HostRadar captures and which recommendations follow from it – complete, area by area.

AreaWhat is capturedExample recommendations
Host CPUHypervisor run time (real physical load), root partition, sockets, cores, NUMA, vCPU:LP ratio, clock throttling, individual overloaded coresHost overloaded, vCPU over-commitment, root partition saturated (check VMQ), CPU throttled
VM CPULoad per VM and vCPU, CPU wait per dispatch (≈ CPU Ready), limits and reservesToo many or too few vCPUs with target value, high CPU wait, vCPUs larger than one NUMA node
MemoryFree/used, assignment per VM, guest memory demand, Dynamic Memory, host paging, Smart PagingMemory demand too high or too low, static or dynamic by role, memory recommendation per host
StorageVolumes incl. CSV, media type (SSD/HDD/NVMe/SAN/Storage Spaces), throughput, IOPS, latency, queue, VHDX, checkpoints, SMB latency, Storage QoSVolume nearly full, high latency, old checkpoints, VHD → VHDX, orphaned differencing disks, QoS limit reached
NetworkPhysical and virtual adapters, utilisation, errors, VMQ/RSS, vSwitches, SET and LBFO teams, VLANs, TCP connectionsAdapter at its limit, team without redundancy, LBFO → SET, high retransmit rate, VMs without their own queue
VM stateHeartbeat, Hyper-V state, integration services, NUMA distribution, Hyper-V ReplicaVM not responding, outdated integration services, memory on a remote NUMA node, replication overdue
CausesPlain-language diagnosis per overload, processes and paging in the guest, Windows event logs of the hosts, known culprits“Storage bottleneck on volume X – affects 6 VMs”, “Host overloaded – the VM is waiting for CPU”
TrendsCapacity forecast, baseline per weekday/hour, idle VMs, performance profile per volume“Volume below 10 % free in about 23 days”, “VM idle for 30 days – frees 4 vCPU and 8 GB”
Load balancingHeadroom of all hosts, hardware, configuration version, CPU generation, space for VHDXUp to three VM moves with load before/after
Clusters & S2DTotals across all nodes, state of nodes, roles and cluster networks, Storage Spaces DirectCluster not N+1 capable, node paused, virtual disk degraded
Drives & hardwareSSD wear, temperature, errors, iLO/iDRAC via Redfish, MPIO, clock drift, power planDrive near end of life, power supply critical, only one MPIO path, clock drifting
Security & best practicesDefender, firewall, Secure Boot, VBS, SMB1, live migration, generation 1, vTPM, time synchronisation“Firewall off: domain”, “Generation 1 – no Secure Boot possible”
Backup & patch levelLast backup per VM (Veeam), Windows Server Backup, patch level, pending reboot“Backup: last run failed”, “Different patch levels in the cluster”
AlertingE-mail and Teams on overload, escalation, end and critical Windows events; maintenance windowsQuiet hours, flap suppression, reminder for ongoing problems
Reports & docsHTML, PDF, CSV, JSON, monthly report with logo, inventory as Excel, change log, licence estimate“Standard: 5 × 16 cores for 9 VMs”, “Datacenter cheaper from about 11 VMs”
PlanningPlan a new VM, savings potential, tickets by e-mail or webhook“VM with 8 vCPU/64 GB fits only on HV03”, “16 vCPUs unused”
BenchmarkStorage benchmark (throughput, IOPS, latency P50/P95/P99), CPU and memory, network path, before/after“A single write takes 8 ms on average – check the RAID controller’s write cache”
User experienceInput delay per session, RDP encoding time, dropped frames, round-trip time to the client, GPU in the guest“Input delay avg 420 ms – 3 of 4 sessions above 200 ms”
Operations & integrationSelf-monitoring, interface for PRTG, Zabbix and Prometheus/Grafana, Active Directory search“Dashboard certificate expires in 12 days”, “HV03 unreachable for 20 min”
ExtensibleAny Windows performance counter and any WQL query via configurationYour own thresholds for warning and critical, above or below

Operations & security

How it runs

  • One-off measurement: HostRadar.exe hv01 hv02 – report within minutes
  • Continuous operation as a Windows service with live dashboard and history
  • Updates with --update, remotely too; if the service does not start, the previous version is restored

What it needs

  • Windows 10/11 or Windows Server 2016+ for HostRadar itself, no .NET installation
  • Hosts with Windows Server 2016 to 2025 and Hyper-V, Azure Local included
  • An account with rights on the hosts and the WMI firewall rules – “Check setup” helps with that

What happens to the data

  • No cloud, no telemetry – everything stays in local files and the history
  • Passwords encrypted with Windows DPAPI, dashboard only with Windows sign-in and HTTPS
  • For IT service providers: monthly report per customer, central overview of several sites

Try HostRadar in your environment

Drop us a line saying how many Hyper-V hosts you look after – you will receive a trial version and answers to your questions.

Request a trial
  1. Copy the EXE to a machine that can reach the hosts
  2. Name the hosts or the cluster – or search Active Directory
  3. Read the report or open the dashboard
Try it without Hyper-V: HostRadar.exe --demo